Dear PD Users,
We have developed a sequence download page on Phytophthora Database.
Please click a link below. You can also find it under Database menu.
Thank you!
Dear PD Users,
We have developed a sequence download page on Phytophthora Database.
Please click a link below. You can also find it under Database menu.
Thank you!
I. Introduction
Many Phytophthora species can be difficult to identify based on morphology due to a lack of physically distinguishing characteristics and variability of morphological characteristics under different culture conditions. Additionally, it may take several days or weeks for an isolate to mature enough to develop identifying characteristics. Because time is often of essence in identifying and assessing the potential risk of a newly isolated pathogen, DNA sequence-based identification is frequently used to augment and complement morphological data.
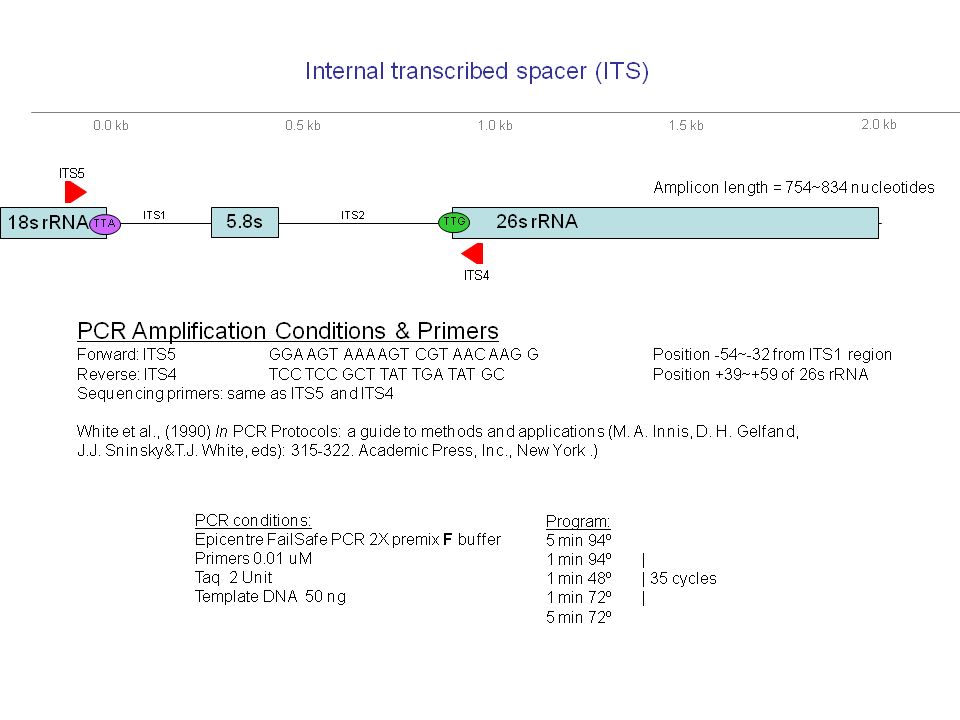
To serve as a baseline for identification, classification, and risk assessment of new Phytophthora isolates, PD cataloged genotypic and phenotypic information on isolates of previously described species in a web-accessible and searchable format. To support the identification of new Phytophthora isolates via comparison of their sequences at one or more loci with the corresponding sequences derived from the isolates archived in PD, sequence data from up to nine loci have been generated from more than 2,000 isolates from known and novel species (94 in total) and deposited the data in PD so that these loci can be used for species identification (Blair et al., 2007; Park et al., 2008). The characterized loci include the following: (i) two loci in the nuclear ribosomal RNA (rRNA) encoding genes: the internal transcribed spacer (ITS) regions and the 5. portion of the large subunit rRNA gene, (ii) nuclear genes encoding 60S ribosomal protein L10, beta-tubulin, enolase, heat shock protein 90, TigA fusion protein, and translation elongation factor 1 alpha, and (iii) a mitochondrially-encoded coxII gene and spacer region between coxI and coxII. PCR reaction conditions for amplifying these marker loci, including the sequences and positions of primers used, can be found in the Genetic Markers section of PD and are hyperlinked from marker names throughout the PD user interface.
A comprehensive phylogenetic analysis was performed (using Pythium vexans as an outgroup) to establish evolutionary relationships among the characterized species (Blair et al., 2007), in which sequences of seven loci (all the markers described above except the ITS and cox regions) derived from 228 isolates from 83 species were utilized. The result is shown in the form of a genus-wide phylogenetic tree via individual species pages in PD and will be updated periodically. Sequences employed in this analysis and sequence alignments are available for downloading. Data search and analysis tools in PD (Fig. 1) include BLAST, Phyloviewer (a program for building phylogenetic trees using sequences of selected isolates), and Virtual Gel (a program for generating expected restriction patterns for given sequences). The PD also provides a customized means of storing and sharing data via the web.
II. Sequence-Based Strain Identification
The following flowchart protocol will provide a descriptive and pictorial explanation of how to use DNA sequence data along with the Phytophthora Database (PD; http://www.phytophthoradb.org) and GenBank search functions in order to identify new isolates. Detailed descriptions of how to use search functions in PD and of how data can be moved from one analysis tool to another can be found in the user manual at the PD web site. The BLAST tool allows for the identification of an unknown isolate by querying the sequence database in PD (and GenBank) using one or more of the marker sequences described above. Given the comprehensive set of ITS sequences available for the archived isolates, we suggest users to begin the identification process using this locus, which should establish its identity at or near the species level.
Once you have submitted your target sequence, the BLAST tool will compare your sequence to sequences contained in your database of choice. The output you will receive will be a list of the CLOSEST but not necessarily EXACT matches (for example if your sequence represents a new species you may not have an exact match). In PD, you will also be provided with links to individual species names and descriptions in the order of the closest matches to your submitted sequence. It is important to look at the output you receive as a COLLECTIVE body of information that suggests what your isolate is most closely related to, rather than a single answer consisting of the top closest match. There are several reasons why this is important: (i) the top closest match may be a misidentified isolate, therefore, using this match as a single identifier for your isolate may be perpetuating a mistake; (ii) even if your isolate has 99% sequence identity to an already described species, several small or singular sequence differences between your isolate and the closest match may suggest that you have a novel species. Given the intensive curation performed on the data archived in PD, the first problem is unlikely (but not impossible). The second situation illustrates why it is often necessary to take the search process further by generating an alignment with the top closest matches and performing a base-by-base visual sequence comparison to determine if there are true differences.
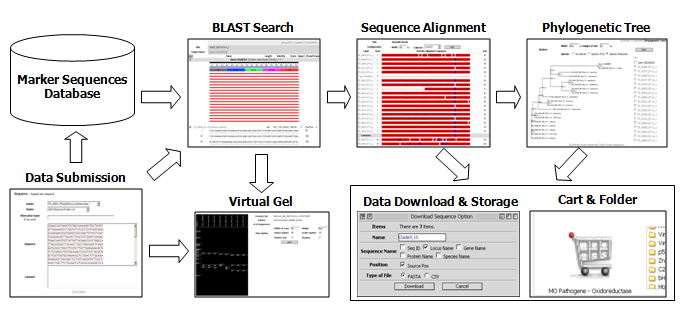
Fig. 1. Overview of the functionality and data flow in PD.
This diagram illustrates (A) BLAST, (B) Clustal W: a tool that will align and illustrate a base-by-base comparison between your isolate and the closest matches, (C) Phyloviewer: a tool to visualize the evolutionary relationship between your isolate and related described species, and (D) the Virtual Gel which displays predicted RFLP patterns from selected sequences (your own and the closest sequence matches). Another helpful feature of PD is that your sequence information, along with the closest matches, alignments, phylogenetic trees, and virtual gels, can be stored in a personal folder (E). You can also restrict or share this data with personalized options.
If the closest match exhibits substantial sequence differences from your sequence, it is possible that the unknown isolate may belong to a new species. In the latter case, one may sequence all or some of the seven loci used for the genus-wide phylogenetic analysis (Blair et al., 2007) to investigate this possibility further. Characterization of morphological and biological traits (e.g., growth characteristics, pathogenicity on plants) will also be needed to formally describe a new species.
III. Literatures Cited
Blair JE, Coffey MD, Park S-Y, Geiser DM, Kang S (2007) A multi-locus phylogeny for Phytophthora utilizing markers derived from complete pathogen genomes. Fungal Genet. Biol. 45:266-277.
Park J, Park B, Veeraraghavan N, Blair JE, Geiser DM, Isard S, Mansfield MA, Nikolaeva E, Park S-Y, Russo J, Kim SH, Greene M, Ivors KL, Balci Y, Peiman M, Erwin DC, Coffey MD, Jung K, Lee Y-H, Rossman A, Farr D, Cline E, Grunwald NJ, Luster DG, Schrandt J, Martin F, Ribeiro OK, Makalowska I, Kang S (2008) Phytophthora Database: A cyberinfrastructure supporting the identification and monitoring of Phytophthora. Plant Dis. 92: 966-972
To provide additional loci that can be used for phylogenetic analysis and molecular identification of isolates, the mitochondrial genes cox2, nad9, rps10 and secY have been sequenced for a wide range of isolates representing essentially all described Phytophthoraspecies (>360 isolates for each gene). Information on amplification and sequencing primers can be found in the “Genetic Markers” section under the “Database” tab and the sequences areavailable for BLAST searches as well as downloading. A comprehensive multigene phylogenetic analysis with the same isolates used for the nuclear multigene analysis of the genus by Blair et al. (Fungal Genetics & Biology, 2008) and many of the more recently described species is in progress and will be posted once the analysis has been completed.
BLAST analysis of the cox2 locus has been found towork very well for identification of isolates and with this updating of the database there are now sequences for over 930 isolates recovered from a broad geographic area to help insure intraspecific variation is represented in the sequence database.
Please contact Frank Martin for additional information or comments.
Monitoring of pathogen populations and lineages provides critical information for disease management including their migration pathways and emergence of novel lineages or races. Simple sequence repeats (SSRs), also known as microsatellites, are choice marker systems for many organisms. In diploid or polyploid species these markers are non-anonymous, co-dominant and almost always selectively neutral, making them more powerful than anonymous markers such as AFLP. The SSR marker-based search function has been developed to allow for the monitoring and visualization of population dynamics within species. Currently, we have SSR data only from P. ramorum, which was generated by Nik Grünwald at USDA-ARS. Read a PLoS Pathogens (2009, 5(9): e100583) paper from his lab to get more detailed information about the loci and primers used to generate this data set. In addition to the SSR genotype, any of the information associated with the characterized P. ramorum isolates can be used as a query to search the isolates. A GIS tool is available to visualize the distribution of individual isolates/genotypes.
Please refer the user guide to learn about the functionality of this new tool. If you are interested to post your SSR data through the Phytophthora Database, please contact Seogchan Kang.